Studying Ohm’s Law with V-I Graph: Objective
To study the relationship between the potential difference (V) across a resistor and the current (I) flowing through it, determine its resistance r and plot a graph between V and I
Apparatus required:
A battery or power supply
A resistor (unknown resistance, say 2 Ω, 3 Ω, 5 Ω, 10 Ω etc.,)
An ammeter (to measure current)
A voltmeter (to measure potential difference)
A rheostat (variable resist0r to change current)
One way plug key (Switch)
Connecting wires
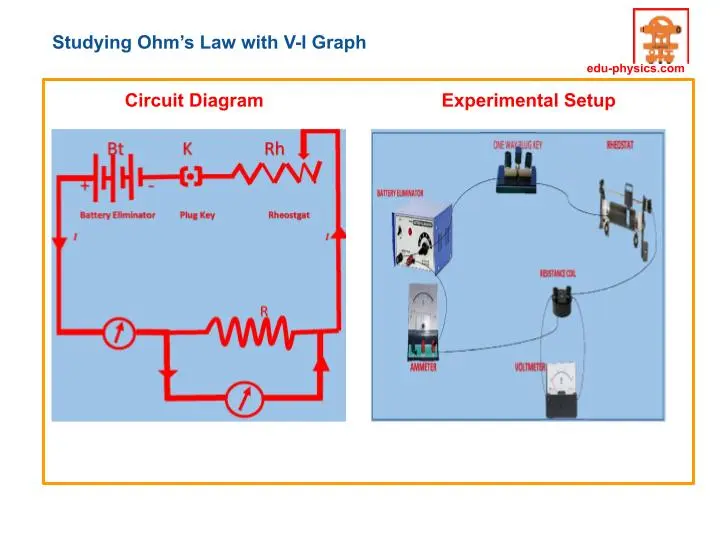
Circuit Diagram & Experimental setup

Theory:
According to Ohm’s law, the potential difference (V) across a resistor is directly proportional to the current flowing through the resistor, provided the temperature remains constant.
V=IR Where
V – Potential difference (in volts, V)
I – Current (in amperes, A)
R – Resistance (in ohms, Ω)
The slope of V vs I graph gives the resistance R
Procedure:
Connect the ammeter in series with the circuit wire and the voltmeter in parallel with the wire.
Note the zero error of the metres.
Calculate the least count of the metres.
Switch on the circuit.
Set the rheostat to a particular position and record the readings of the ammeter and voltmeter.
Repeat steps 5 and 6 for different settings of the rheostat.
Least count of ammeter:

Least count of Voltmeter:

Tabular Column & Observations

Studying Ohm’s law with V-I Graph- Graphical method to find resistance

Studying Ohm’s law with V-I graph: Result
The V-I Graph is a straight line, verifying Ohm’s law.
The resistance(R) of the given resistor is found to be 3 Ω (From experiment)
The resistance(R) of the given resistor is found to be 3 Ω (From Graphical method)
Precautions:
Ensure all connections are tight.
The ammeter should always be connected in series and the voltmeter in parallel
Avoid high current to prevent heating the resistor and consequently the resistance value will also increase.
Take readings quickly to minimize temperature changes
Plug out the key (switch off) when you are not taking the readings.
Links to other cbse class 10 practical experiments
Laisser un commentaire