CBSE Class 12 Physics | NEET Preparation | Modern Physics | eduPhysics
Introduction to the Photoelectric Effect
The photoelectric effect is one of the most important phenomena in modern physics. It provides compelling evidence for the particle nature of light and played a crucial role in the development of quantum theory.
When light of a suitable frequency falls on the surface of a metal, electrons may be emitted from the metal. These emitted electrons are called photoelectrons, and the phenomenon is known as the photoelectric effect.
The photoelectric effect was investigated experimentally by Heinrich Hertz, further studied by Wilhelm Hallwachs and Philipp Lenard, and successfully explained by Albert Einstein in 1905 using Planck’s quantum hypothesis. Einstein received the 1921 Nobel Prize in Physics for his work on the photoelectric effect.
Photoelectric effect – Definition
The photoelectric effect is the phenomenon of emission of electrons from a metal surface when electromagnetic radiation of sufficiently high frequency falls on it.
The emitted electrons are called photoelectrons, and the electric current produced by their directed motion is called photocurrent.
Key concept: The frequency of incident light determines the maximum kinetic energy of the emitted photoelectrons, while the intensity of suitable-frequency light primarily determines the number of photoelectrons emitted per second.
1. Experimental Study of the Photoelectric Effect
The experimental study of the photoelectric effect helps us understand how the frequency and intensity of incident light affect electron emission and the resulting electric current.
Experimental arrangement
The photoelectric effect can be studied using an evacuated glass tube containing two electrodes.
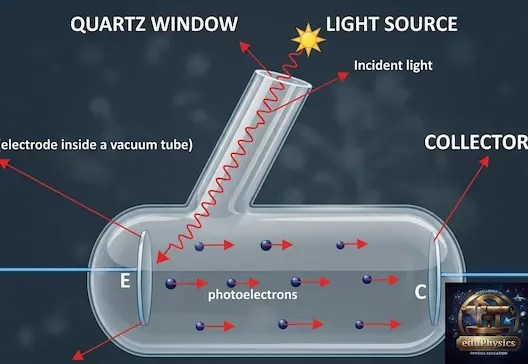
The main components of the experimental arrangement are:
- Photosensitive cathode (E): A metal surface that emits electrons when suitable light falls on it.
- Collector or anode (C): An electrode that collects the emitted photoelectrons.
- Quartz window: Allows suitable ultraviolet radiation to enter the evacuated tube.
- Light source: Provides incident radiation of adjustable frequency and intensity.
- Variable voltage source: Controls the potential difference between the cathode and collector.
- Microammeter: Measures the small photocurrent flowing through the circuit.
The evacuated tube allows photoelectrons to travel between the electrodes with minimal collisions with gas molecules.
Working principle
When light falls on the photosensitive cathode, electrons absorb energy from the incident radiation. If the energy absorbed is sufficient to overcome the metal’s work function, an electron can escape from the surface.
The emitted photoelectrons move towards the positively charged collector, producing a photocurrent in the external circuit.
By varying the light intensity, frequency and potential difference between the electrodes, we can investigate the characteristics of photoelectric emission.
Experimental procedure
- Illuminate the photosensitive cathode with monochromatic light of a known frequency.
- Measure the photocurrent at different accelerating potentials.
- Increase the accelerating potential until the photocurrent reaches saturation.
- Reverse the applied potential to oppose the motion of photoelectrons.
- Increase the retarding potential until the photocurrent becomes zero.
- Repeat the experiment using different light intensities and frequencies.
These observations reveal the fundamental laws of photoelectric emission.

2. Important Terms in the Photoelectric Effect
Work function (φ)
The work function of a metal is the minimum energy required to remove an electron from its surface.
It is usually expressed in electron volts (eV) or joules (J).
Work function = Planck’s constant × Threshold frequency
φ = hν₀
Here, h is Planck’s constant and ν₀ is the threshold frequency of the metal.
Threshold frequency (ν₀)
The threshold frequency is the minimum frequency of incident radiation required to cause photoelectric emission from a particular metal surface.
If the incident frequency is below the threshold frequency, photoelectric emission does not occur in the ordinary one-photon photoelectric effect, regardless of how intense the light is.
Threshold frequency = Work function ÷ Planck’s constant
ν₀ = φ/h
The corresponding threshold wavelength is:
λ₀ = hc/φ
Here, c is the speed of light in vacuum and λ₀ is the threshold wavelength.
Therefore, photoelectric emission is possible when:
- Incident frequency ≥ Threshold frequency
- Incident wavelength ≤ Threshold wavelength
Photoelectric current (I)
Photoelectric current is the electric current produced by the collected photoelectrons.
For a given collection arrangement, increasing the intensity of light of frequency above the threshold generally increases the number of electrons emitted per second and hence the photocurrent.
Saturation current (Iₛ)
Saturation current is the maximum photocurrent obtained when essentially all photoelectrons emitted by the cathode are collected by the anode.
Further increasing the accelerating potential does not appreciably increase the current once saturation is reached.
Stopping potential (Vₛ)
The stopping potential is the minimum magnitude of the reverse potential difference required to reduce the photocurrent to zero.
It is also called the cut-off potential.
The maximum kinetic energy of photoelectrons is related to stopping potential by:
Maximum kinetic energy = Electronic charge × Stopping potential
Kₘₐₓ = eVₛ
Here, e is the magnitude of the electronic charge.
The stopping potential measures the maximum kinetic energy of emitted electrons, not the average kinetic energy of all photoelectrons.
3. Einstein’s Photoelectric Equation
Einstein explained the photoelectric effect by proposing that light exchanges energy with matter in discrete packets called photons.
The energy of a photon is:
E = hν
An electron uses part of this energy to escape from the metal surface. The remaining energy appears as the kinetic energy of the emitted electron.
According to the principle of conservation of energy:
Photon energy = Work function + Maximum kinetic energy
Therefore:
hν = φ + Kₘₐₓ
Rearranging:
Kₘₐₓ = hν − φ
Since the work function is equal to hν₀:
Kₘₐₓ = h(ν − ν₀)
Using the stopping potential:
eVₛ = hν − φ
Therefore:
Vₛ = (h/e)ν − φ/e
These equations are fundamental to understanding the experimental observations of the photoelectric effect.
What does Einstein’s equation tell us?
- If photon energy is less than the work function, ordinary one-photon photoelectric emission does not occur.
- If photon energy equals the work function, electrons can just escape with zero maximum excess kinetic energy.
- If photon energy exceeds the work function, the maximum kinetic energy increases with the frequency of the incident radiation.
Increasing the frequency increases the energy available per photon. Increasing the intensity at a fixed frequency above threshold generally increases the photon flux, not the energy of each photon.
4. Laws of Photoelectric Emission
The experimental study of the photoelectric effect establishes the following laws under ordinary photoelectric-emission conditions.
Law 1: Existence of a threshold frequency
For every photosensitive material, there is a minimum frequency called the threshold frequency.
Photoelectric emission does not occur when the incident frequency is below this value, irrespective of the intensity of the incident light.
Law 2: Photocurrent depends on the intensity of incident light
For a fixed frequency above the threshold and a suitable collection voltage, the photocurrent increases with the intensity of incident radiation.
Greater intensity means more photons arriving per unit time. Consequently, more photoelectrons are generally emitted per unit time.
The saturation current is approximately proportional to the incident intensity under otherwise unchanged experimental conditions.
Law 3: Maximum kinetic energy depends on frequency
The maximum kinetic energy of photoelectrons increases linearly with the frequency of incident radiation above the threshold.
It does not depend on the intensity of light when the frequency and other experimental conditions remain unchanged.
According to Einstein’s equation:
Kₘₐₓ = hν − φ
The slope of a graph of maximum kinetic energy against frequency is Planck’s constant, h.
Law 4: Photoelectric emission is practically instantaneous
Under ordinary experimental conditions, photoelectrons are emitted without a measurable time lag when suitable radiation falls on the metal surface.
This observation is inconsistent with the classical expectation that an electron must accumulate energy gradually from a weak light wave over a substantial time.
Law 5: Stopping potential depends on frequency
For a given photosensitive material, the stopping potential increases linearly with the frequency of the incident radiation above threshold.
It is independent of the intensity of incident light when the frequency is fixed and the experimental conditions remain unchanged.
The relationship is:
Vₛ = (h/e)(ν − ν₀)
This law directly supports Einstein’s photon theory of light.
5. Graphical Representation of the Photoelectric Effect
Graphs are extremely important for CBSE Class 12 Physics and NEET examinations. They help us understand the relationship between photocurrent, light intensity, incident frequency, applied potential and stopping potential.
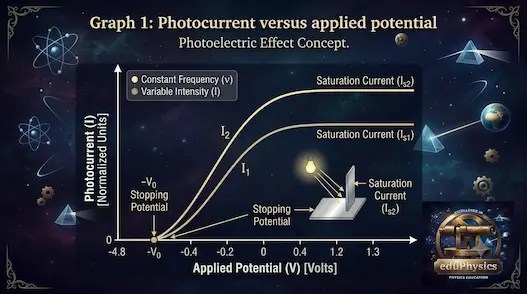
Consider the variation of photocurrent with the potential difference between the collector and the photosensitive cathode.
Observations:
- When the collector is made increasingly positive, more photoelectrons reach it and the photocurrent increases.
- At a sufficiently large positive potential, nearly all emitted photoelectrons are collected. The current reaches saturation.
- When the collector is made negative, it repels the emitted electrons, and the photocurrent decreases.
- At the stopping potential, even the most energetic photoelectrons cannot reach the collector, and the photocurrent becomes zero.
Important conclusion: The saturation current depends primarily on the intensity of incident light, whereas the stopping potential depends on the maximum kinetic energy of the photoelectrons.
Graph 2: Effect of intensity on photocurrent
Suppose monochromatic light of a fixed frequency greater than the threshold frequency falls on a metal surface.
When the intensity of incident light is increased:
- More photons strike the metal per unit time.
- More photoelectrons are generally emitted per unit time.
- The saturation current increases.
- The stopping potential remains unchanged, provided the frequency and experimental conditions remain the same.
For two intensities, I₁ and I₂, where I₂ is greater than I₁, the corresponding saturation currents satisfy:
Iₛ₂ > Iₛ₁
The stopping potential is the same for both intensities.
Graph 3: Effect of frequency on stopping potential
Einstein’s photoelectric equation gives:
Vₛ = (h/e)ν − φ/e
This is the equation of a straight line.
A graph of stopping potential Vₛ against incident frequency ν has the following characteristics:
- Slope: h/e
- Frequency-axis intercept: Threshold frequency ν₀
- Stopping potential at threshold: Zero
- Vertical-axis intercept: −φ/e, obtained by extrapolation.
The slope is universal for ideal photoelectric measurements because it depends on Planck’s constant and the elementary charge, not on the identity of the metal.

Graph 4: Maximum kinetic energy versus frequency
Using Einstein’s equation:
Kₘₐₓ = hν − φ
A graph of maximum kinetic energy Kₘₐₓ against frequency is a straight line with slope h.
The graph intersects the frequency axis at ν₀, where the maximum excess kinetic energy is zero.
For frequencies above threshold, increasing the frequency increases the maximum kinetic energy linearly.
Graph 5: Maximum kinetic energy versus intensity
For a fixed incident frequency above threshold, changing the intensity does not change the maximum kinetic energy of photoelectrons in the ordinary one-photon photoelectric effect.
Therefore, a graph of maximum kinetic energy against light intensity is a horizontal line, assuming all other conditions remain unchanged.
NEET tip: Do not confuse a graph of photocurrent against applied potential with a graph of maximum kinetic energy against frequency. They represent different experimental relationships.
6. Experimental Observations and Their Explanations
| Experimental observation | Explanation |
| No emission below threshold frequency | Photon energy is insufficient to overcome the work function. |
| Photocurrent increases with intensity | More photons arrive per unit time, generally producing more photoelectrons. |
| Maximum kinetic energy increases with frequency | Photon energy increases with frequency. |
| Stopping potential is independent of intensity at fixed frequency | The maximum energy per photon remains unchanged. |
| Saturation current is reached | Almost all emitted photoelectrons are collected. |
| Emission is practically instantaneous | An electron can receive the required energy through a single photon interaction. |
7. Worked Numerical Examples
Example 1: Calculating the energy of a photon
Calculate the energy of a photon of frequency 6 × 10¹⁴ Hz.
Given:
- Frequency = 6 × 10¹⁴ Hz
- Planck’s constant = 6.626 × 10⁻³⁴ J s
Using the photon energy formula:
Energy = Planck’s constant × Frequency
E = (6.626 × 10⁻³⁴) × (6 × 10¹⁴)
E = 3.976 × 10⁻¹⁹ J
In electron volts:
Energy in eV = Energy in joules ÷ 1.602 × 10⁻¹⁹
E ≈ 3.976 × 10⁻¹⁹ ÷ 1.602 × 10⁻¹⁹
E ≈ 2.48 eV
Example 2: Finding the maximum kinetic energy
The work function of a metal is 2 eV. Light of photon energy 5 eV falls on its surface. Calculate the maximum kinetic energy of the emitted photoelectrons.
Using Einstein’s equation:
Maximum kinetic energy = Photon energy − Work function
Kₘₐₓ = 5 − 2
Kₘₐₓ = 3 eV
Example 3: Calculating stopping potential
If the maximum kinetic energy of photoelectrons is 2.5 eV, find the stopping potential.
Maximum kinetic energy = Electronic charge × Stopping potential
When kinetic energy is expressed in electron volts, the numerical value of the stopping potential in volts is the same.
Stopping potential = 2.5 V
Example 4: Finding threshold frequency
The work function of a metal is 3.3 × 10⁻¹⁹ J. Calculate its threshold frequency.
Threshold frequency = Work function ÷ Planck’s constant
ν₀ = (3.3 × 10⁻¹⁹) ÷ (6.626 × 10⁻³⁴)
ν₀ ≈ 4.98 × 10¹⁴ Hz
8. Applications of the Photoelectric Effect
The photoelectric effect and related photoelectric technologies have important applications in science and industry.
Photocells: Convert incident light into an electrical signal and are used in light-sensitive control circuits.
Automatic lighting systems: Light sensors can switch streetlights on or off according to ambient illumination.
Optical detectors: Photodetectors are used in optical communication, scientific instruments and measurement systems.
Security systems: Light-sensitive devices can detect interruptions in a beam and trigger alarms.
Photomultiplier tubes: These devices use photoelectron emission and electron multiplication to detect extremely weak light signals.
Solar cells: Photovoltaic devices convert light into electrical energy through a related but distinct semiconductor process. Their operation should not be confused with the emission of electrons from a metal into a vacuum in the classical photoelectric-effect experiment.
9. Limitations of Classical Wave Theory
Classical wave theory could not adequately explain several observations of the photoelectric effect.
- Threshold frequency: Classical theory did not predict a sharp minimum frequency for emission.
- Intensity and kinetic energy: It could not explain why increasing light intensity at a fixed frequency does not increase the maximum kinetic energy of photoelectrons.
- Frequency dependence: It did not explain the linear relationship between maximum kinetic energy and frequency.
- Instantaneous emission: It could not satisfactorily explain the absence of a measurable time lag under ordinary experimental conditions.
Einstein’s photon model explained these observations by treating light energy as quantized.
10. Photoelectric Effect: Quick Revision Notes
The photoelectric effect demonstrates the particle-like behaviour of light.
Photon energy = hν.
Work function is the minimum energy needed to remove an electron from a metal surface.
Threshold frequency = φ/h.
Einstein’s equation: Kₘₐₓ = hν − φ.
Maximum kinetic energy = eVₛ.
Saturation current increases with the intensity of suitable-frequency light.
Stopping potential increases with incident frequency above threshold.
At fixed frequency, increasing intensity does not increase maximum kinetic energy in the ordinary one-photon effect.
The slope of the stopping-potential-versus-frequency graph is h/e.
The slope of the maximum-kinetic-energy-versus-frequency graph is h.
11. Frequently Asked Questions
What is the photoelectric effect?
It is the emission of electrons from a material surface when incident radiation has sufficient frequency to overcome the material’s work function.
What is threshold frequency?
It is the minimum frequency of incident radiation required to produce photoelectric emission from a particular material under ordinary one-photon conditions.
What is stopping potential?
It is the magnitude of the reverse potential needed to reduce the photocurrent to zero by preventing even the most energetic photoelectrons from reaching the collector.
Does increasing light intensity increase stopping potential?
No. At a fixed frequency above threshold, increasing intensity generally increases photocurrent but does not increase the stopping potential.
Why does photocurrent increase with light intensity?
Higher intensity generally means a greater number of photons incident on the surface per unit time, resulting in more emitted photoelectrons per unit time.
Why does increasing frequency increase maximum kinetic energy?
The energy of a photon is hν. After the electron uses energy to overcome the work function, the remaining energy appears as its maximum kinetic energy.
What is the relationship between work function and threshold frequency?
Work function = Planck’s constant × Threshold frequency
φ = hν₀
A metal with a larger work function has a higher threshold frequency.
Can intense light below the threshold frequency cause photoelectric emission?
Not in the ordinary one-photon photoelectric effect. Special multiphoton processes can occur under sufficiently intense laser illumination, but these are beyond the standard CBSE and NEET treatment.
Conclusion
The photoelectric effect established that light exchanges energy with matter in discrete quanta called photons. Its experimental laws cannot be explained satisfactorily by classical wave theory alone, but Einstein’s photoelectric equation explains the dependence of photoelectron kinetic energy on frequency, the existence of threshold frequency and the relationship between stopping potential and photon energy.
For CBSE Class 12 Physics and NEET aspirants, mastering the experimental arrangement, laws of photoelectric emission, Einstein’s equation and the standard graphs is essential for conceptual clarity and numerical problem-solving.
Learn Physics with eduPhysics: Explore more Class 12 Physics notes, NEET Physics MCQs, practical experiments, solved numericals and exam-focused study resources at edu-physics.com.
Leave a Reply